Maryland's Largest School District
45 West Gude Drive, Suite 4000
Rockville, MD 20850
Email: Sustainability@mcpsmd.org
Phone: 240-740-3210
Fax: 301-279-3005

Sensors have been placed in–
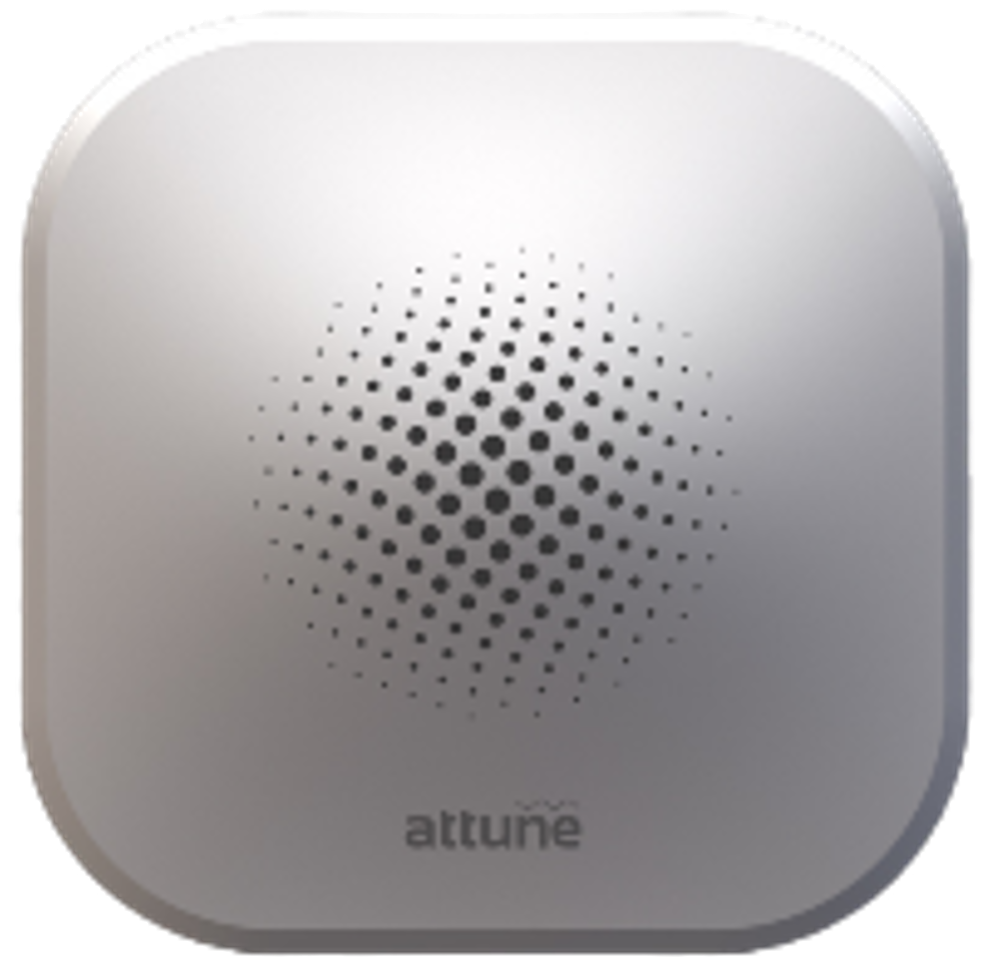
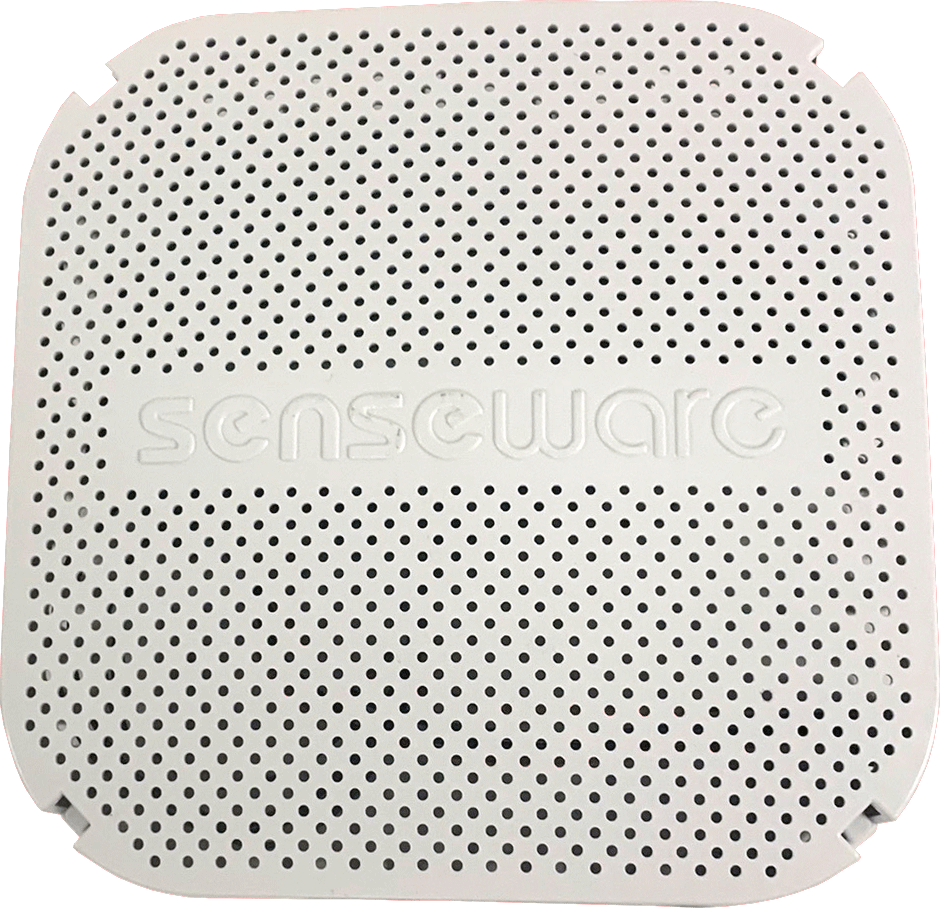
Two models of sensor boxes have been deployed throughout MCPS. The sensors won’t be noticeable or disrupt classroom activities; they are small white boxes that look very similar to an Apple TV box affixed to a wall. Although there are two exterior models that may appear different on the outside (pictured below), the inner components have been standardized throughout the school system. There is no need to worry if you see blinking lights; they indicate various communication statuses of the devices. Examples of each type of sensor are pictured below.
Sensors are placed in strategic locations of rooms and record temperature, humidity, and carbon dioxide (CO2). The sensors also detect the presence of airborne pollutants such as particulate matter (PM), volatile organic compounds (VOCs), ozone (O3), and carbon monoxide (CO).
The size of the facility determines the number of sensors installed and the sampling locations. A typical elementary school has more than 30 sampling locations with an average of 300 sensors.
Each sensor collects and transmits minute-by-minute data to a central computer platform. That data is then analyzed and reviewed by our facilities management team members who evaluate, triage, and take corrective action or coordinate repairs as necessary.
All Montgomery County Public Schools will have indoor air quality sensors for the upcoming school year and moving forward. Installation has been completed at all existing schools. Spaces that have been newly constructed or renovated for Fall 2023 occupancy will have sensors installed by the end of December 2023.
Because of the volume of data the system collects, the public view has been designed to serve thousands of users. To keep the system robust and live, adding additional data to the website would cause poor (slow) system performance. The displays will evolve over time.
The technology is a very useful tool for environmental and facilities professionals, but requires knowledge of building systems. Staff use classroom-level data to identify overall trends and understand the patterns to implement corrective measures.
Attune, formerly known as Senseware, is a leader in wireless, sensor-based monitoring systems. The Attune technology is a first-of-its-kind sensor-based Internet of Things (IoT) platform supported by 52 patents.
This contract was awarded to Attune following the Request for Proposal process. The Board of Education approved the contract award on August 23, 2022.
Attune has successfully demonstrated improved indoor air monitoring capabilities while working with many school districts across the United States, including:
The lights do not provide any information about the data being collected in the room. They are used to help Attune technical staff understand how the system is communicating with the computer network.
The sensors measure various parameters that indicate comfort, particles that can be respired (breathed in), and ventilation quality.
Temperature and humidity are considered indicators of thermal comfort. MCPS Temperature Setpoints: 70°F for heating and 76°F for cooling. Summer temperatures between 72°F and 80°F, and winter temperatures between 68°F and 74°F, with humidity between 30% and 60%, are acceptable for thermal comfort. ANSI/ASHRAE 62.1 and 62.2 - Standards 62.1 & 62.2.
Particulate Matter is the mixture of solid particles and liquid droplets found in the air. Some particles, such as dust, dirt, soot, or smoke, are large or dark enough to be seen with the naked eye. Others are so small they can only be detected using an electron microscope. PM1.0 and PM2.5 measure the amount of particulate matter smaller than 1.0 microns and 2.5 microns, respectively, also known as fine particles, which can pose a health risk. For reference, the diameter of human hair is about 70 microns. Particulate Matter (PM) Basics | US EPA
The World Health Organization (WHO) guidelines state that annual average concentrations of Particulate Matter below 2.5 microns (PM2.5) should not exceed 5 µg/m3, while 24-hour average exposures should not exceed 15 µg/m3 more than 3-4 days per year. There is no standard set by the U.S. Environmental Protection Agency (EPA), but more information can be found on their website at Particulate Matter (PM)Pollution US EPA
Carbon Dioxide (CO2) is produced from human respiration and tends to increase as more people are present in a building. In classrooms, CO2 concentrations are an indicator of ventilation effectiveness, with low CO2 concentrations indicating more effective ventilation.
Currently, there are no regulatory guidelines or industry consensus on what low-level CO2 concentrations should or should not be.
Additional guidance for ventilation in educational and child care facilities are available at the following:
Total Volatile Organic Compounds (TVOCs) are gases emitted from a large number of solids and liquids, as well as people (from our personal care products). They include a variety of chemicals, some of which may have short- and long-term health effects. TVOC measurements are used as an indicator of ventilation performance. More information can be found on the EPA website at Volatile Organic Compounds' Impact on Indoor Air Quality | US EPA
It is important to note that VOC concentrations/levels can be affected by many everyday products and activities. Examples include, but are not limited to:
Carbon Monoxide (CO): Carbon monoxide is a colorless, odorless gas. It results from incomplete combustion processes. Common sources of CO in schools are improperly vented furnaces, malfunctioning gas ranges, canned heat (e.g. a Sterno), or exhaust fumes that have been drawn back into the building. Worn or poorly adjusted and maintained combustion devices (e.g., boilers, furnaces), or a flue that is improperly sized, blocked, disconnected, or leaking, can be significant sources. Auto, truck, or bus exhaust from attached garages, nearby roads, or idling vehicles in parking areas can also be sources. Carbon monoxide at a high concentration is considered to be a serious health hazard. Carbon Monoxide's Impact on Indoor Air Quality | US EPA
Ozone (O3): Ozone is a reactive form of Oxygen. It is a strong oxidizer with deodorant and antiseptic properties. It is also a respiratory, ocular, and nasal irritant with a characteristic odor. Ozone is produced by the action of ultraviolet sunlight on oxygen. It can also be prepared in a laboratory setting.
The sensors selected are factory-calibrated and designed for high accuracy and low drift, particularly for temperature and humidity. The CO2 sensors use automatic baseline correction (ABC) algorithms to compensate for drift over time. The IAQ monitors have received UL 2905 validation, which certifies their performance against industry standards for indoor air quality sensors. In addition, we conduct spot checks twice a year using portable reference instruments to verify readings. These checks also help confirm that the dynamic sensor correction for CO2 remains effective over time.
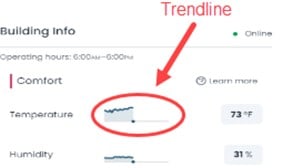
The median is an indicator of overall IAQ and HVAC performance in each school. In addition to the current readings, you are also able to see each day’s data as a trendline, as shown in the sample image below.
MCPS developed thresholds to respond to the sensor data. The threshold values are based on IAQ industry national consensus standards and best practices, best available scientific information, and collaborative work sessions with the MCCPTA Health and Wellness Committee and the MCCPTA School Construction Work Group. This is a living document and will be modified as necessary.
MCPS Indoor Air Quality Threshold Table
Moving forward, MCPS looks ahead to expanding the use and application of this data internally with our partners at Attune.
Staff in the Division of Sustainability and Compliance (DSC) and the Division of Design and Construction (DDC) monitor live data during construction. This allows MCPS Staff to identify concerns and work with on-site personnel to resolve or plan for corrective action.
Please note that this Web page contains links to one or more pages that are outside MCPS. MCPS does not control the content or relevancy of those pages.