
Mission
Every student will have the academic, creative problem solving and social-emotional skills to be successful in college and career.
Vision
We inspire learning by providing the greatest public education to each and every student.
Core Purpose
Prepare all students to thrive in their futures.
Core Values
- Learning
- Relationships
- Respect
- Excellence
- Equity
MCPS at a Glance 2022-2023
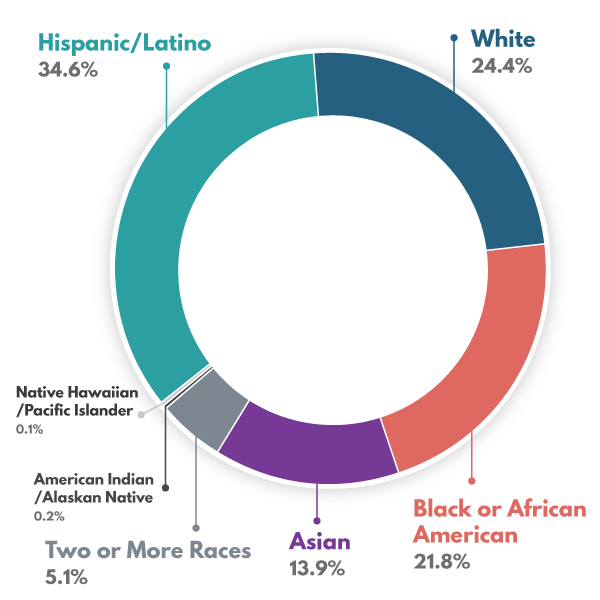
Student Demographics
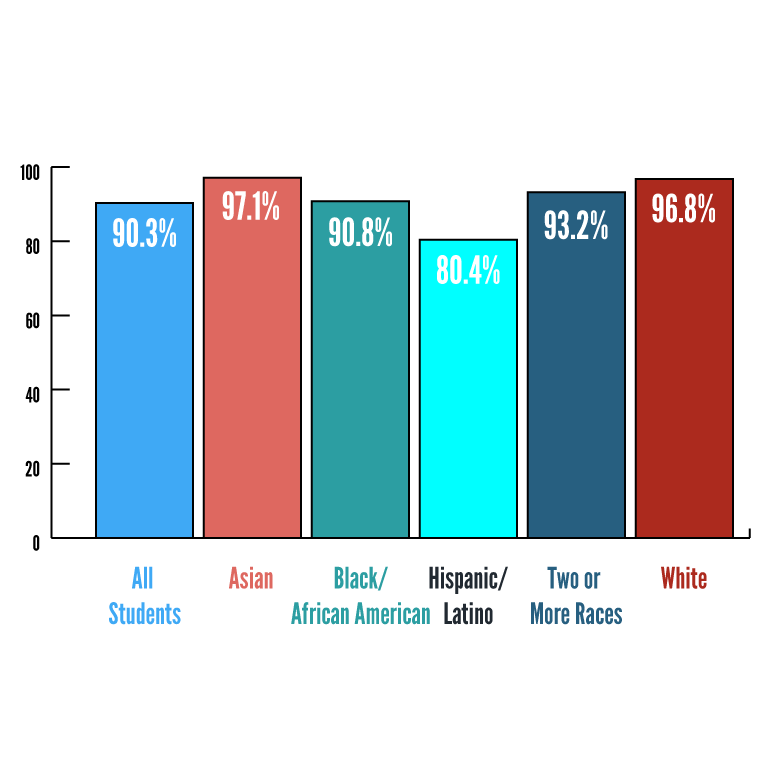
Graduation Rates 2022
2023 data coming in March 2024

211 Schools
136 Elementary Schools / 40 Middle Schools / 25 High Schools / 5 Special Schools / 2 Early Childhood Centers / 2 Programs / 1 Special Service Program / 1 Technology High School

160,554 Students

Largest District
in Maryland

162 Languages
Our students speak

24,907 Workforce
2023 number of employees
School
Profiles
School Profiles are a one-stop shop for MCPS school data. They include Schools-at-a-Glance data and the new Academic Pathway measures.
Learn More
Strategic
Plan
Every four years, the Montgomery County Board of Education (BOE) establishes a strategic plan to guide the work of Montgomery County Public Schools (MCPS).
Learn More

Capital
Improvements
Long-range facility plans, and recommended capital projects, are shown with their completion schedules.
Learn MoreResources
Community
- Get Involved: Ways to contribute to making our schools better
- Programs and Services available from the school system, the county, and the state
- Our Partners: Who we work with at the county, state, and federal level