Full Menu
Math 8 | Unit 1 2 3 4 5 6 7 8 9
Proportional Relationships
Representing Linear Relationships
Finding Slopes
This week your student will consider what it means to make a useful graph that represents a situation and use graphs, equations, tables, and descriptions to compare two different situations.
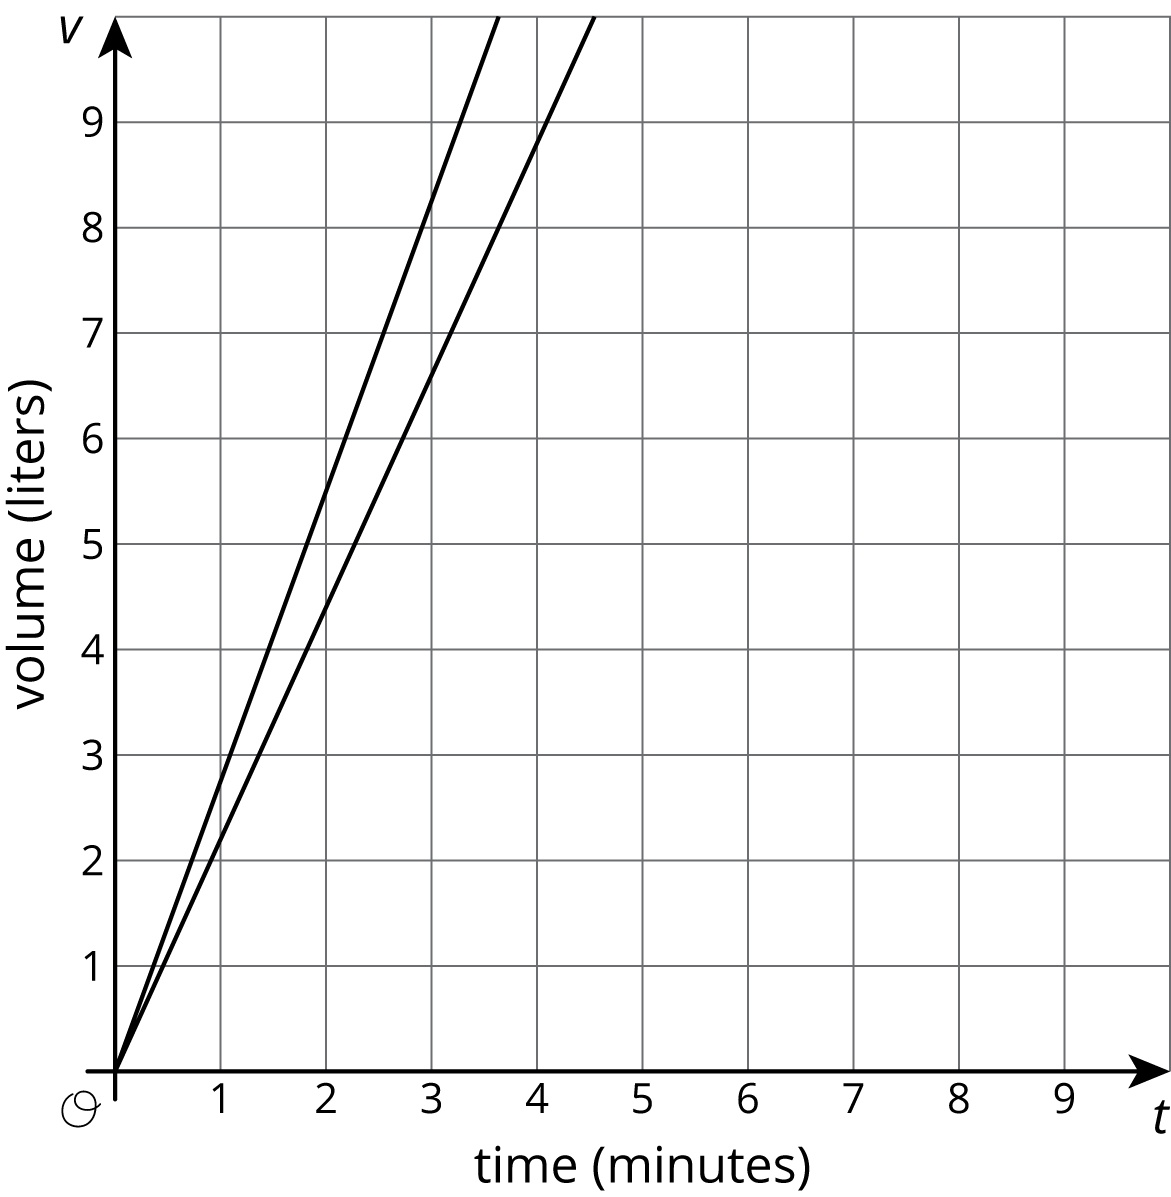
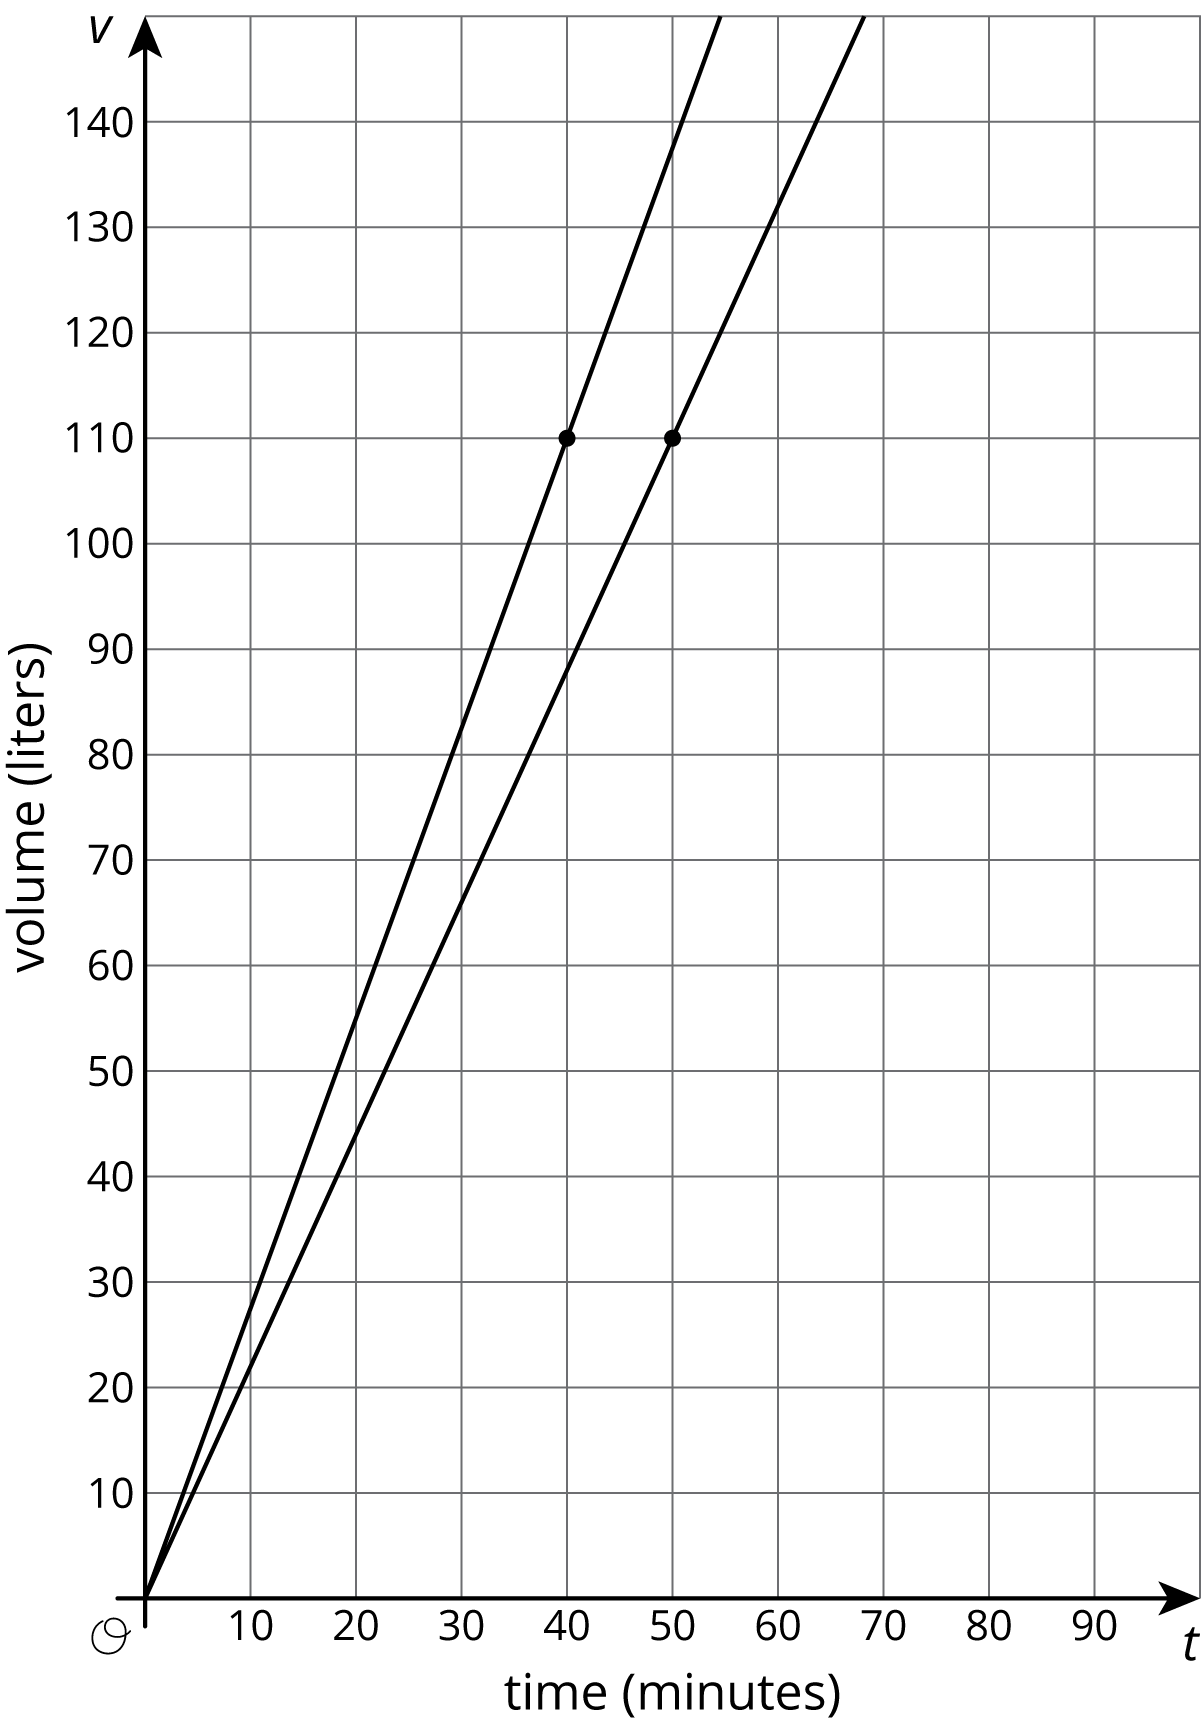
There are many successful ways to set up and add scale to a pair of axes in preparation for making a graph of a situation. Sometimes we choose specific ranges for the axes in order to see specific information. For example, if two large, cylindrical water tanks are being filled at a constant rate, we could show the amount of water in them using a graph like this:
While this graph is accurate, it only shows up to 10 liters, which isn’t that much water. Let’s say we wanted to know how long it would take each tank to have 110 liters. With 110 as a guide, we could set up our axes like this:
Notice how the vertical scale goes beyond the value we are interested in. Also notice how each axis has values that increase by 10, which, along with numbers like 1, 2, 5, 25, is a friendly number to count by.
Here is a task to try with your student:
This table shows some lengths measured in inches and the equivalent length in centimeters.
Solution:
This week your student will learn how to write equations representing linear relationships. A linear relationship exists between two quantities where one quantity has a constant rate of change with respect to the other. The relationship is called linear because its graph is a line.
For example, say we are 5 mile into a hike heading toward a lake at the end of the trail. If we walk at a speed of 2.5 miles per hour, then for each hour that passes we are 2.5 miles further along the trail. After 1 hour we would be 7.5 miles from the start. After 2 hours we would be 10 miles from the start (assuming no stops). This means there is a linear relationship between miles traveled and hours walked. A graph representing this situation is a line with a slope of 2.5 and a vertical intercept of 5.
The graph shows the height in inches, h, of a bamboo plant t months after it has been planted.
This week your student will investigate linear relationships with slopes that are not positive. Here is an example of a line with negative slope that represents the amount of money on a public transit fare card based on the number of rides you take:
The slope of the line graphed here is -2.5 since slope=vertical changehorizontal change=-4016=-2.5. This corresponds to the cost of 1 ride. The vertical intercept is 40, which means the card started out with $40 on it.
One possible equation for this line is y=-2.5x+40. It is important for students to understand that every pair of numbers (x,y) that is a solution to the equation representing the situation is also a point on the graph representing the situation. (We can also say that every point (x,y) on the graph of the situation is a solution to the equation representing the situation.)
A length of ribbon is cut into two pieces. The graph shows the length of the second piece, x, for each length of the first piece, y.
IM 6–8 Math was originally developed by Open Up Resources and authored by Illustrative Mathematics, and is copyright 2017-2019 by Open Up Resources. It is licensed under the Creative Commons Attribution 4.0 International License (CC BY 4.0). OUR's 6–8 Math Curriculum is available at https://openupresources.org/math-curriculum/.