
Mathematics Support

Math 6 | Unit 1 2 3 4 5 6 7 8 9


Equations in One Variable

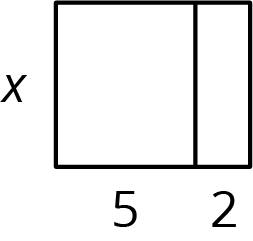
This week your student will be learning to visualize, write, and solve equations. They did this work in previous grades with numbers. In grade 6, we often use a letter called a variable to represent a number whose value is unknown. Diagrams can help us make sense of how quantities are related. Here is an example of such a diagram:


Since 3 pieces are labeled with the same variable x, we know that each of the three pieces represent the same number. Some equations that match this diagram are x+x+x=15 and 15=3x.

solution to an equation is a number used in place of the variable that makes the equation true. In the previous example, the solution is 5. Think about substituting 5 for x in either equation: 5+5+5=15 and 15=35 are both true. We can tell that, for example, 4 is not a solution, because 4+4+4 does not equal 15.

Solving an equation is a process for finding a solution. Your student will learn that an equation like 15=3x can be solved by dividing each side by 3. Notice that if you divide each side by 3, 15÷3=3x÷3, you are left with 5=x, the solution to the equation.

Here is a task to try with your student:

Draw a diagram to represent each equation. Then, solve each equation.


2y=11


11=x+2


Solution:


y=5.5 or y=112


x=9


Equal and Equivalent

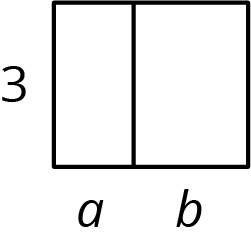
This week your student is writing mathematical expressions, especially expressions using the distributive property.

In this diagram, we can say one side length of the large rectangle is 3 units and the other is x+2 units. So, the area of the large rectangle is 3(x+2). The large rectangle can be partitioned into two smaller rectangles, A and B, with no overlap. The area of A is 6 and the area of B is 3x. So, the area of the large rectangle can also be written as 3x+6. In other words,

3(x+2)=3x+32

This is an example of the distributive property.


Here is a task to try with your student:

Draw and label a partitioned rectangle to show that each of these equations is always true, no matter the value of the letters.

  • 5x+2x=(5+2)x
  • 3(a+b)=3a+3b

Solution:

Answers vary. Sample responses:


Expressions with Exponents

This week your student will be working with exponents. When we write an expression like 7n, we call n the exponent. In this example, 7 is called the base. The exponent tells you how many factors of the base to multiply. For example, 74 is equal to 7777. In grade 6, students write expressions with whole-number exponents and bases that are

  • whole numbers like 74
  • fractions like (17)4
  • decimals like 7.74
  • variables like x4

Here is a task to try with your student:

Remember that a solution to an equation is a number that makes the equation true. For example, a solution to x5=30+x is 2, since 25=30+2. On the other hand, 1 is not a solution, since 15 does not equal 30+1. Find the solution to each equation from the list provided.

  1. n2=49
  2. 4n=64
  3. 4n=4
  4. (34)2=n
  5. 0.23=n
  6. n4=116
  7. 1n=1
  8. 3n÷32=33

List: 0,0.008,12,916,68,0.8,1,2,3,4,5,6,7

Solution:

  1. 7, because 72=49. (Note that -7 is also a solution, but in grade 6 students aren’t expected to know about multiplying negative numbers.)
  2. 3, because 43=64
  3. 1, because 41=4
  4. 916, because (34)2 means (34)(34)
  5. 0.008, because 0.23 means (0.2)(0.2)(0.2)
  6. 12, because (12)4=116
  7. Any number! 1n=1 is true no matter what number you use in place of n.
  8. 5, because this can be rewritten 3n÷9=27. What would we have to divide by 9 to get 27? 243, because 279=24335=243.

Relationships Between Quantities

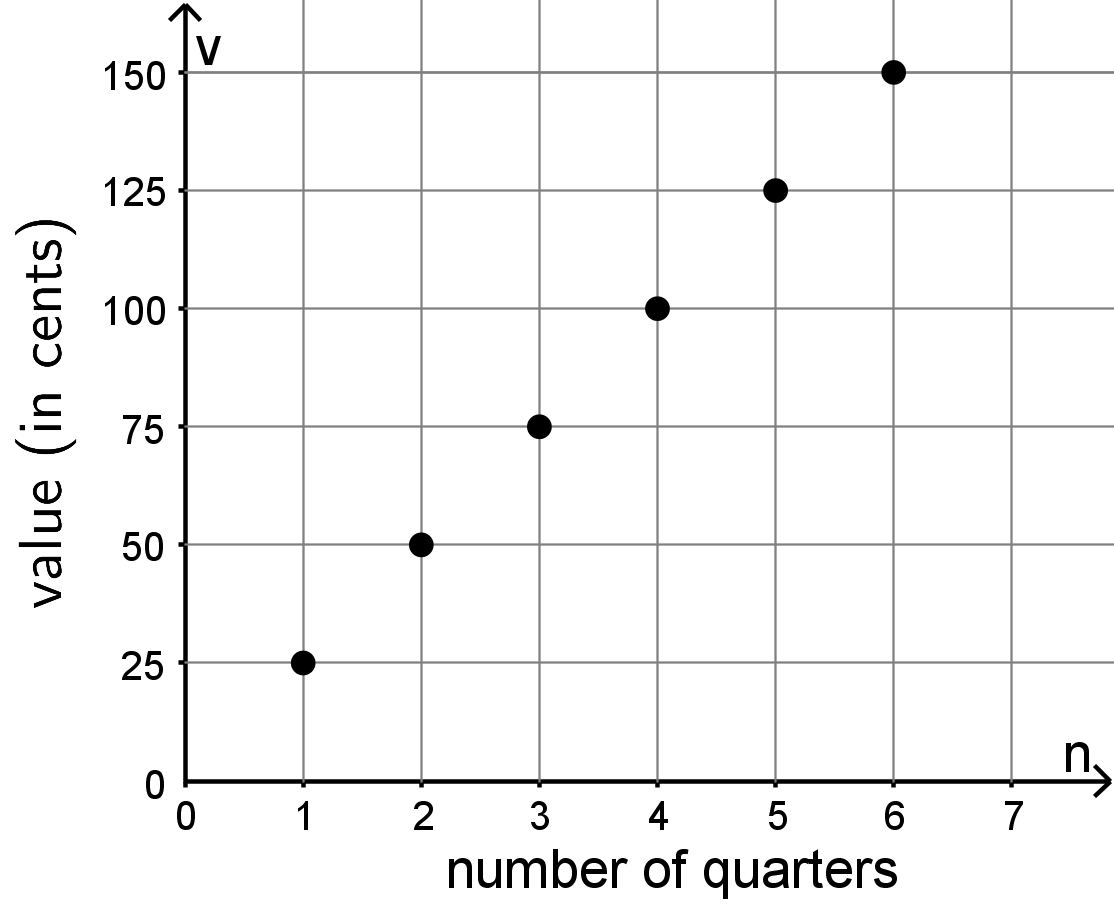
This week your student will study relationships between two quantities. For example, since a quarter is worth 25?, we can represent the relationship between the number of quarters, n, and their value v in cents like this:


v=25n


We can also use a table to represent the situation.

n v
1 25
2 50
3 75

Or we can draw a graph to represent the relationship between the two quantities:

Here is a task to try with your student:

A shopper is buying granola bars. The cost of each granola bar is $0.75.

  1. Write an equation that shows the cost of the granola bars, c, in terms of the number of bars purchased, n.
  2. Create a graph representing associated values of c and n.
  3. What are the coordinates of some points on your graph? What do they represent?

Solutions

  1. c=0.75n. Every granola bar costs $0.75 and the shopper is buying n of them, so the cost is 0.75n.
  2. Answers vary. One way to create a graph is to label the horizontal axis with "number of bars" with intervals, 0, 1, 2, 3, etc, and label the vertical axis with "total cost in dollars" with intervals 0, 0.25, 0.50, 0.75, etc.
  3. If the graph is created as described in this solution, the first coordinate is the number of granola bars and the second is the cost in dollars for that number of granola bars. Some points on such a graph are (2,1.50) and (10,7.50)

IM 6–8 Math was originally developed by Open Up Resources and authored by Illustrative Mathematics, and is copyright 2017-2019 by Open Up Resources. It is licensed under the Creative Commons Attribution 4.0 International License (CC BY 4.0). OUR's 6–8 Math Curriculum is available at https://openupresources.org/math-curriculum/.


Disclaimer: This site provides external links and videos as a convenience and for informational purposes only. The appearance of external hyperlinks on the MCPS Family Mathematics Support Center website does not constitute an endorsement by the Montgomery County Public School System of any of the products or opinions contained therein.