 MONTGOMERY COUNTY PUBLIC SCHOOLS
 MONTGOMERY COUNTY PUBLIC SCHOOLS
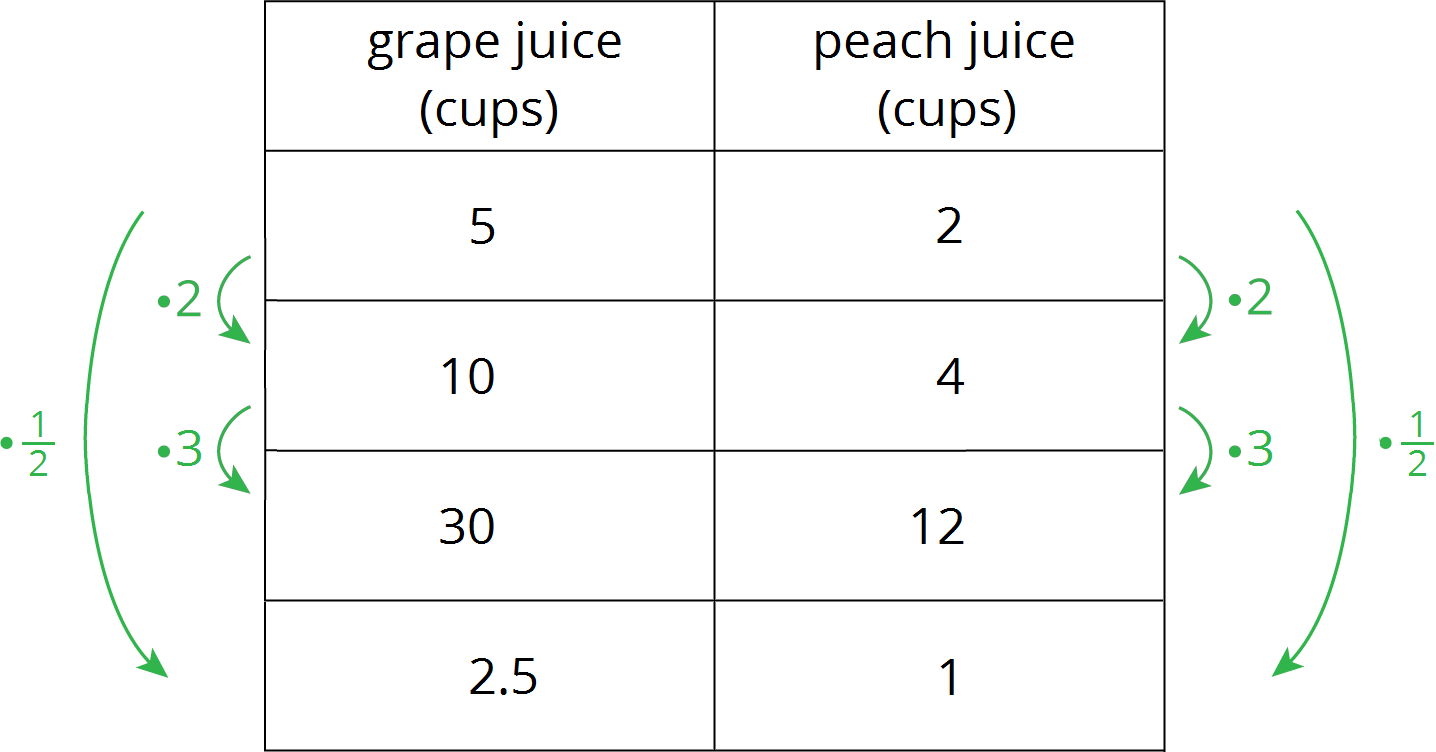
This week your student will learn about proportional relationships. This builds on the work they did with equivalent ratios in grade 6. For example, a recipe says “for every 5 cups of grape juice, mix in 2 cups of peach juice.” We can make different-sized batches of this recipe that will taste the same.

The amounts of grape juice and peach juice in each of these batches form equivalent ratios.
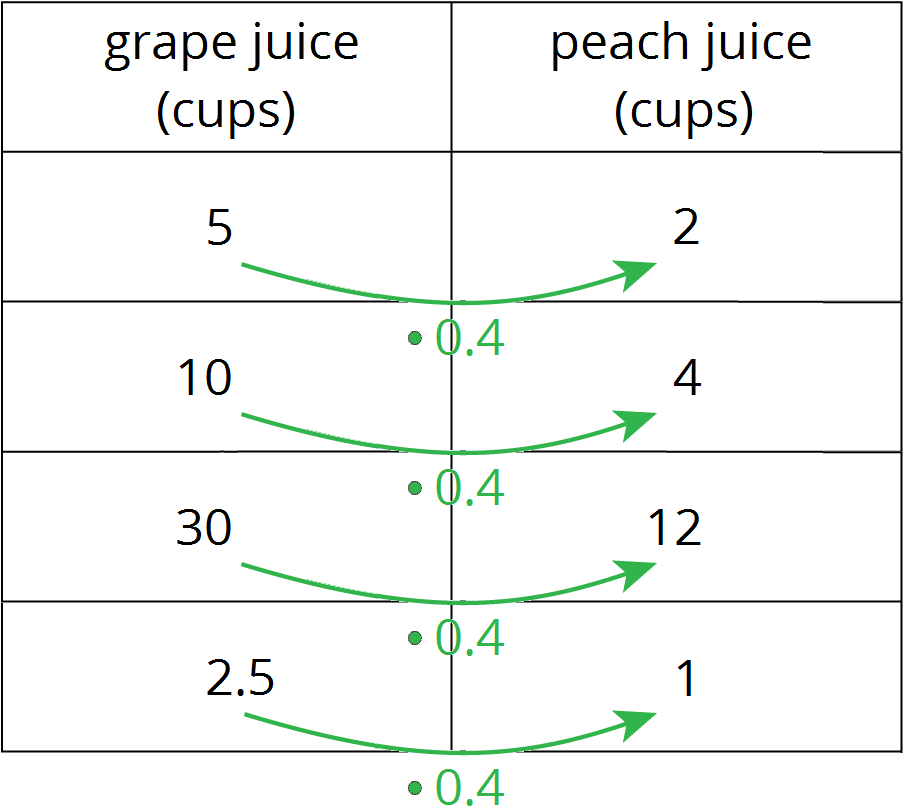
The relationship between the quantities of grape juice and peach juice is a proportional relationship. In a table of a proportional relationship, there is always some number that you can multiply by the number in the first column to get the number in the second column for any row. This number is called the constant of proportionality.
In the fruit juice example, the constant of proportionality is 0.4. There are 0.4 cups of peach juice per cup of grape juice.
Here is a task you can try with your student:
Using the recipe “for every 5 cups of grape juice, mix in 2 cups of peach juice”
Solution:
This week your student will learn to write equations that represent proportional relationships. For example, if each square foot of carpet costs $1.50, then the cost of the carpet is proportional to the number of square feet.
The constant of proportionalityin this situation is 1.5. We can multiply by the constant of proportionality to find the cost of a specific number of square feet of carpet.
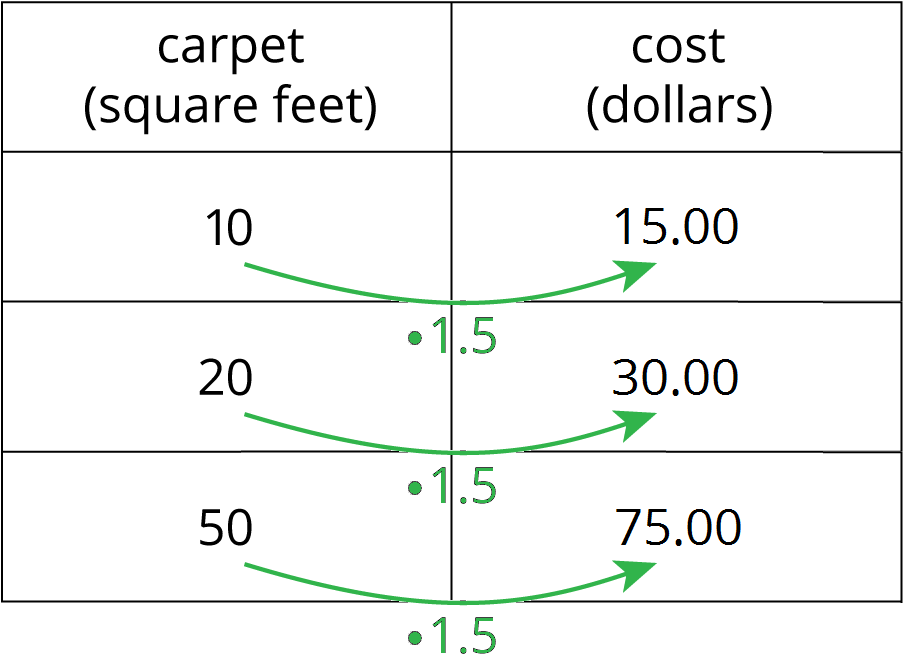
We can represent this relationship with the equation
The equation for any proportional relationship looks like
Here is a task to try with your student:
Solution:
This week your student will work with graphs that represent proportional relationships. For example, here is a graph that represents a relationship between the amount of square feet of carpet purchased and the cost in dollars.
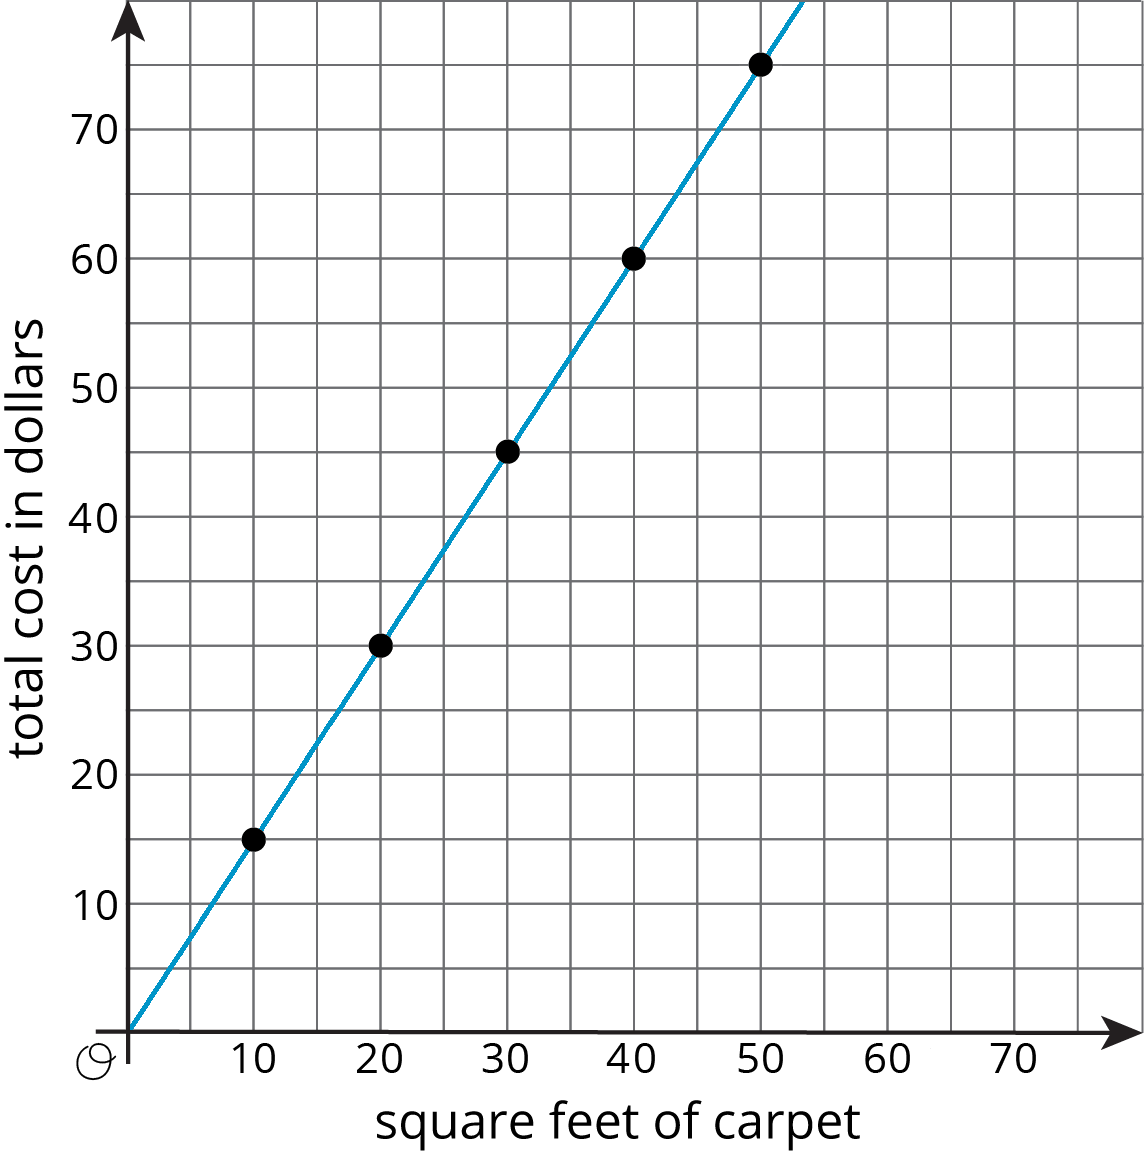
Each square foot of carpet costs $1.50. The point
Notice that the points on the graph are arranged in a straight line. If you buy 0 square feet of carpet, it would cost $0. Graphs of proportional relationships are always parts of straight lines including the point
Here is a task to try with your student:
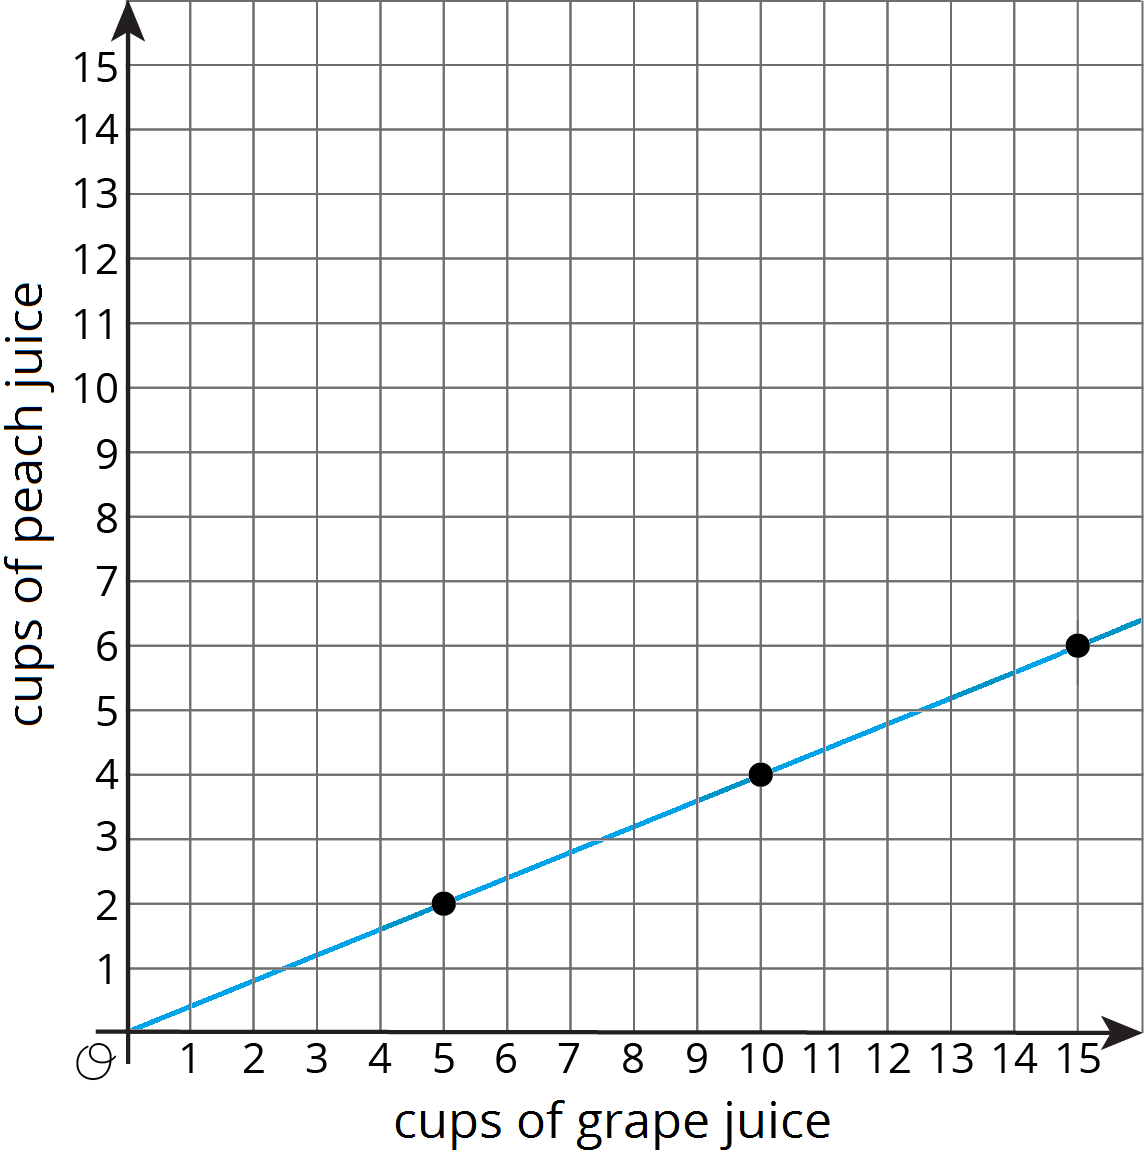
Create a graph that represents the relationship between the amounts of grape juice and peach juice in different-sized batches of fruit juice using the recipe “for every 5 cups of grape juice, mix in 2 cups of peach juice.”
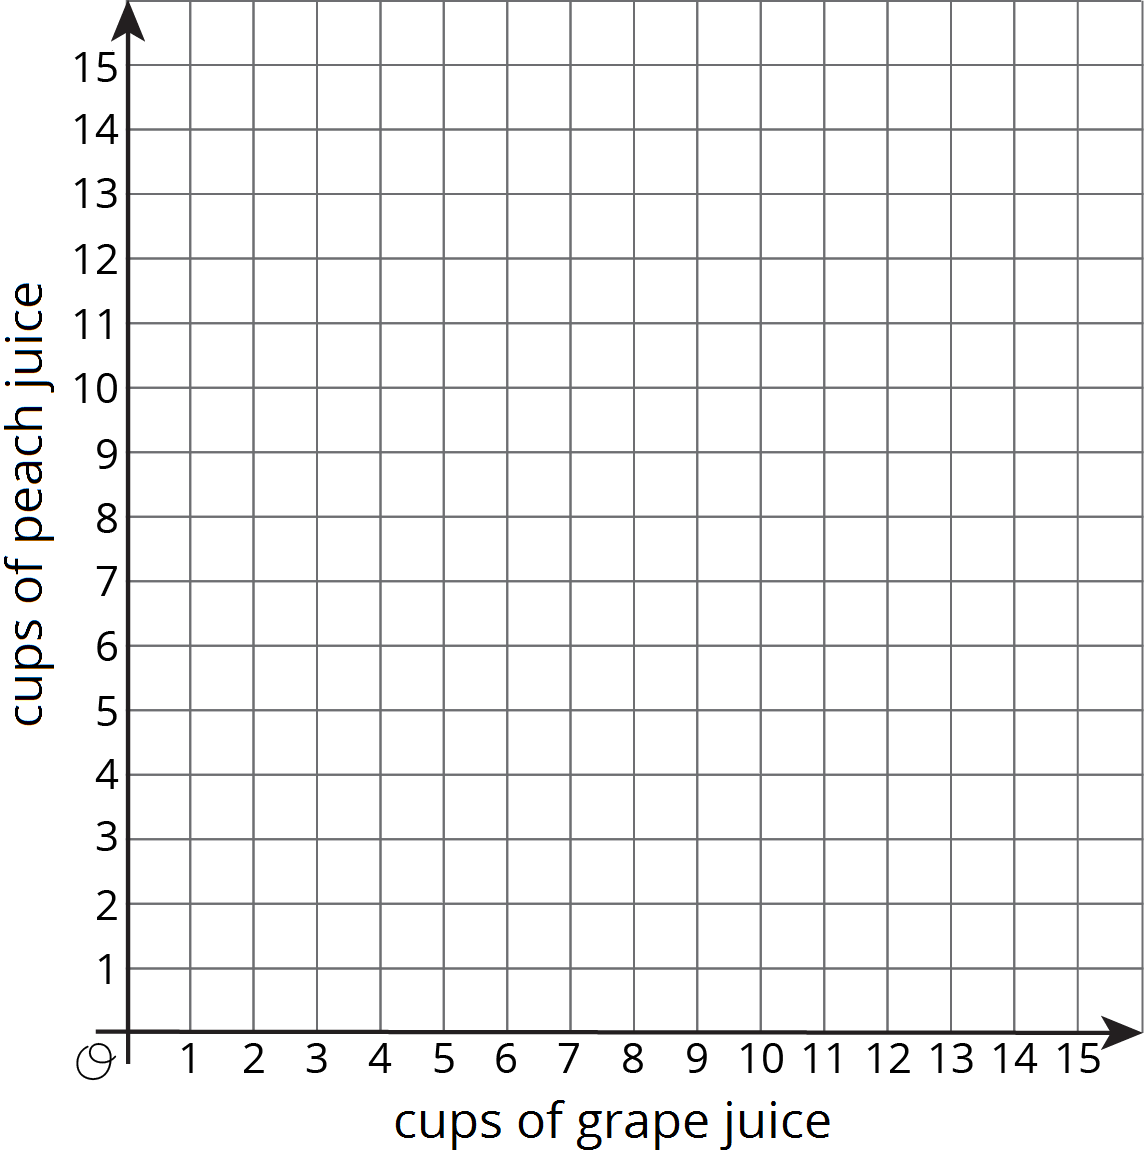
Solution:
IM 6–8 Math was originally developed by Open Up Resources and authored by Illustrative Mathematics, and is copyright 2017-2019 by Open Up Resources. It is licensed under the Creative Commons Attribution 4.0 International License (CC BY 4.0). OUR's 6–8 Math Curriculum is available at https://openupresources.org/math-curriculum/.