
Maryland's Largest School District
This week, your student will be working with functions. A function is a rule that produces a single output for a given input.
Not all rules are functions. For example, here’s a rule: the input is “first letter of the month” and the output is “the month.” If the input is J, what is the output? A function must give a single output, but in this case the output of this rule could be January, June, or July, so the rule is not a function.
Here is an example of a rule that is a function: input a number, square it, then multiply the result by

We could also represent this function with an equation,
Here is a task to try with your student:
Jada can buy peanuts for $0.20 per ounce and raisins for $0.25 per ounce. She has $12 to spend on peanuts and raisins to make trail mix for her hiking group.
Solution:
This week, your student will be working with graphs of functions. The graph of a function is all the pairs (input, output), plotted in the coordinate plane. By convention, we always put the input first, which means the inputs are represented on the horizontal axis and the outputs on the vertical axis.
For a graph representing a context, it is important to specify the quantities represented on each axis. For example this graph shows Elena’s distance as a function of time. If it is distance from home, then Elena starts at some distance from home (maybe at her friend’s house), moves further away from her home (maybe to a park), stays there a while, and then returns home. If it is distance from school, the story is different.
The story also changes depending on the scale on the axes: is distance measured in miles and time in hours, or is distance measured in meters and time in seconds?
Here is a task to try with your student:
Match each of the following situations with a graph (you can use a graph multiple times). Define possible inputs and outputs, and label the axes.

Solution:
In each case, the horizontal axis is labeled with the input, and the vertical axis is labeled with the output.
This week your student will be working with volumes of three-dimensional objects. We can determine the volume of a cylinder with radius
Just like a rectangular prism, the volume of a cylinder is the area of the base times the height. For example, let’s say we have a cylinder whose radius is 2 cm and whose height is 5 cm like the one shown here:
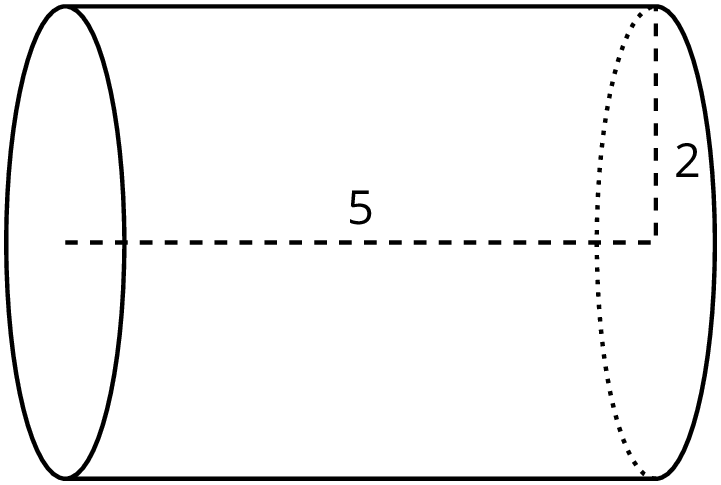
The base has an area of
Here is a task to try with your student:
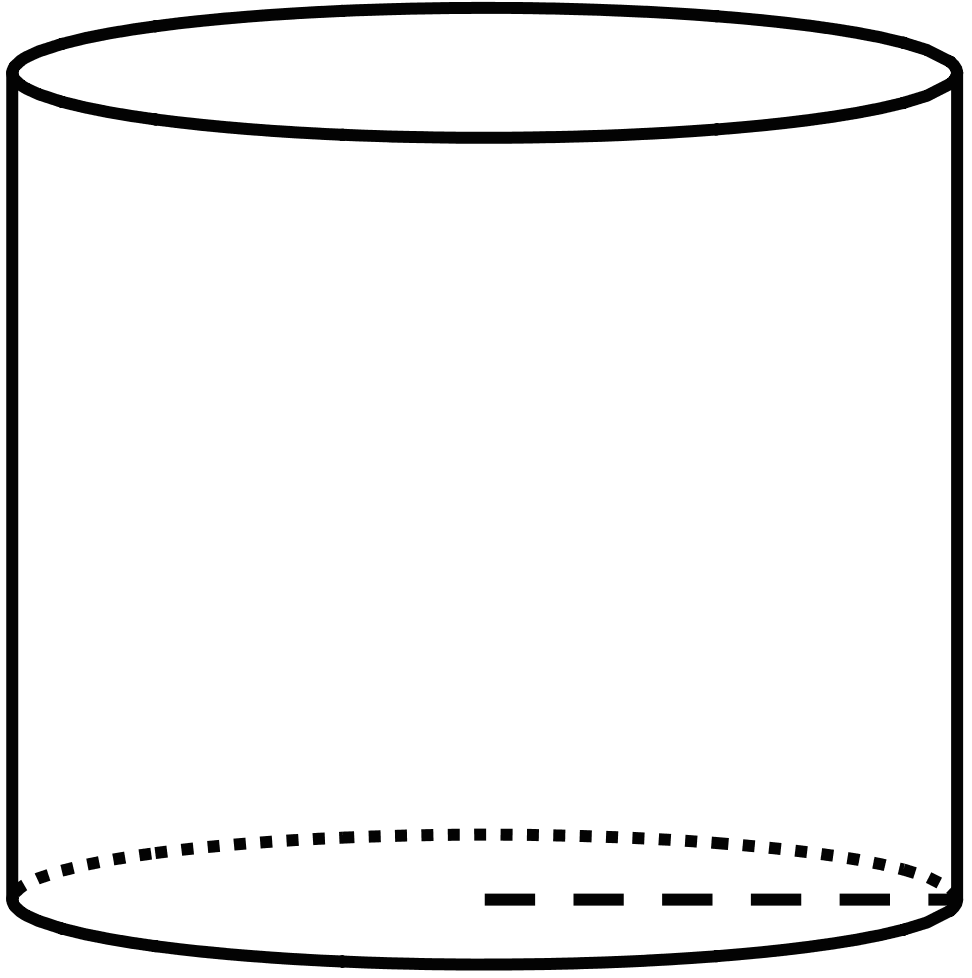
This cylinder has a height and radius of 5 cm. Leave your answers in terms of
Solution:
This week, your student will compare the volumes of different objects. Many common objects, from water bottles to buildings to balloons, are similar in shape to rectangular prisms, cylinders, cones, and spheres—or even combinations of these shapes. We can use the volume formulas for these shapes to compare the volume of different types of objects.
For example, let’s say we want to know which has more volume: a cube-shaped box with an edge length of 3 centimeters or a sphere with a radius of 2 centimeters.
The volume of the cube is 27 cubic centimeters since
Here is a task to try with your student:
A globe fits tightly inside a cubic box. The box has an edge length of 8 cm.
Solution:
IM 6–8 Math was originally developed by Open Up Resources and authored by Illustrative Mathematics, and is copyright 2017-2019 by Open Up Resources. It is licensed under the Creative Commons Attribution 4.0 International License (CC BY 4.0). OUR's 6–8 Math Curriculum is available at https://openupresources.org/math-curriculum/.