Maryland's Largest School District
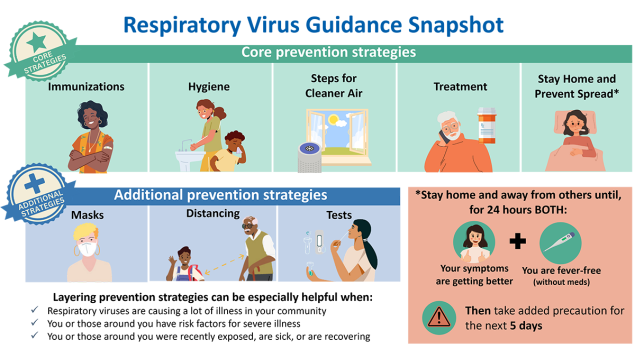
As of April 15, 2024, MCPS is updating procedures for COVID-19 and other common respiratory viruses to align with the latest guidance from the Centers for Disease Control & Prevention and endorsed by the Maryland Department of Health.