| Complete Report: 1 - 2 - 3 - 4 - 5 - 6 - 7 | 2000 SAT Report: HOME |
|
|
|
2000 Scholastic Assessment Test (SAT) Results for Montgomery County Public Schools
SYSTEMIC PLANNING FOR SAT PREPARATION
Department of Educational Accountability
MONTGOMERY COUNTY PUBLIC SCHOOLS
Rockville, Maryland 20850
June 6, 1997
MEMORANDUM
To: Mrs. Katheryn W. Gemberling, Deputy Superintendent of Schools
From: John C. Larson, Coordinator for Research and Evaluation
Through: Marlene Hartzman, Director
Subject: Systemic Planning for SAT Preparation
As a result of the decrease in SAT scores for African American seniors reported by the College Board for the Class of 1996, Superintendent Vance directed the Office of School Administration to send intervention teams to the six high schools that had shown the greatest drop in average SAT scores among African American seniors since the Class of 1995. Dr. Vance also directed the Department of Educational Accountability to review current research; to consult with Dr. Sylvia Johnson, a Howard University professor noted for her work studies on the achievement of African American students; and, to analyze student course-taking and test performance in MCPS. This memorandum reviews the results from DEA's analyses of SAT scores and recommendations following from those findings and the discussions with Dr. Johnson.
The activities of the six intervention teams, as reported in a series of OSA updates, encompassed a broad array of features designed to expand students' preparation for and participation in the SAT. Many of those activities provide models of how other high schools can enhance the college readiness of their students, and we are optimistic about the results for the Class of 1997.
While much of the intervention teams' work this year has focused on producing immediate results, it was also important to broaden our perspective on preparing students for higher education. Since over 86 percent of our graduates continue education after high school, there is a critical need for a systemic strategy to support college preparation and SAT performance. Dr. Johnson's experience emphasized the importance of early academic preparation as the cornerstone of high school success, and the value of parent-school collaboration. She noted in particular the need for school staff to reach out to African American students, encouraging and supporting them to seek academic excellence in elementary school and to pursue challenging academic courses in secondary school. The "Blueprint for Action" formulated by the National Conference on Educating Black Children3 listed a variety of activities for students, teachers, parents, administrators and community intended to support the school achievement of African American students. A number of these activities have been adopted by the Intervention Teams at the six high schools.
3 The Washington Urban League, A Blueprint For Action II, National Conference on Educating Black Children, September, 1986, Washington D.C.
A recent study from the National Center for Educational Statistics4 reinforces this well-established, multi-factor view of influences on learning. The authors concluded, from a national sample of students moving from eighth grade through tenth grade, that (a) family resources and learning activities, (b) school climate and learning opportunities, and (c) individual student characteristics, taken together, account for much of the student differences in high school math and science performance. Each of these domains of influence, considered alone, played only a small role in performance, but the combined effects of all three domains were very significant because the three domains are so highly interrelated. This means that approaches to improving achievement for African American students should include all three domains. The researchers provide four succinct but comprehensive recommendations: (1) Use holistic approaches (home, school, individual) for improving learning; (2) start improvement programs early; (3) improvement programs begin at home; and (4) focus on disadvantaged schools (p. vi.)
4 Peng, Samuel S., Wright, DeeAnn, and Hill, Susan T. (1995) Understanding Racial-Ethnic Differences in Secondary School Science and Mathematics Achievement. (NCES 95-710) Washington, D.C.: National Center for Educational Statistics.
Drawing upon those insights and the analyses of MCPS data from the SAT, this memorandum provides a framework for improving SAT performance that articulates short-term activities in high school with intermediate-term activities spanning the middle school and high school years, and long-term activities involving K-8 academic preparation.
The evidence presented below illustrates that significant progress has been made during the past five years in the long-term and intermediate-term preparation of students for college readiness. This increased "educational productivity," for all racial/ethnic groups, bodes well for the performance of seniors on the SAT in the next few years. Short-term strategies can ensure fuller participation of prepared students and embellish the SAT scores of students at test-taking time. However, sustained, long-term educational productivity of the teachers and staff is essential to support further SAT gains for all students.
Elementary and middle school preparation provide the foundation from which students can fully participate in a challenging high school academic program. Analyses of our local Criterion Referenced Tests show that higher scores translate directly into greater participation and success in the high school curriculum for all groups of students. These tests have recently become established as part of the assessment infrastructure in order to guide curriculum revision and articulation from one grade and school level to the next, and to provide indicators of school accountability for continuous improvement.
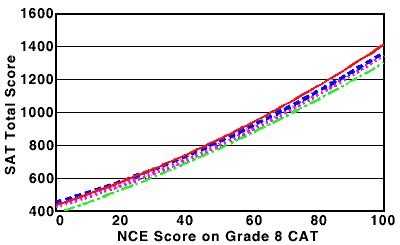
Analyses of over 22,000 SAT records from six recent cohorts of seniors in MCPS reinforce the importance of K-8 preparation. Those results showed that almost half of the differences among seniors' SAT scores could be traced to their differences in eighth grade academic standing, as measured by the California Achievement Tests (see Table 1.) This relationship of eighth grade academic standing to future SAT performance was essentially the same for all racial/ethnic groups (see Figure 1.) This means that improved academic performance from elementary school through middle school will, for all students, translate into improved SAT performance upon leaving high school. It is important that elementary and middle school staff see their work as clearly connected with the college readiness of their students years later, and help to motivate all students to engage and persist in academic pursuits.
Analyses of the CRT between the first year of their use in 1994 and the most recent 1996 data provide evidence of increased educational productivity. Throughout the entire range of socioeconomic diversity found among MCPS elementary schools, the school averages of fifth grade CRT Math scores improved significantly. This means that students, on average, entered middle school better prepared in 1996 than in 1994.
Nearly half of the differences among seniors' SAT scores is due to their differences in high school course selections and performance as measured by their highest level of math studied, their academic grade-point averages and their total number of honors credits earned in high school (see Table 1.) The magnitude of this "high school effect" was similar for all racial/ethnic groups. The fact that high school course-taking and performance make such significant differences in SAT scores, apart from the benefits of pre-high school preparation, means that students and staff must not think of SAT scores as fixed "traits." Instead, staff and parents should encourage and support students in their selections of challenging courses and rigorous academic work. Intermediate-term preparation for the SAT begins with the first semester of ninth grade and continues throughout each course in each semester of high school.
Furthermore, the racial group differences among students that start high school at the same level of academic preparation, and then pursue an equivalent series of academic courses, are only a fraction of the overall racial differences in SAT scores reported by the College Board. For example, Table 1 shows a difference of 239 points between the overall SAT averages of the African American and the Asian seniors. However, for students with the same eighth grade preparation and similar profiles of high school course-taking and preparation, the African American and Asian groups would differ by only 33 points. This means that sustained student effort combined with appropriate encouragement and counseling throughout high school will significantly improve the student's SAT scores by twelfth grade. Several of the high school intervention teams have implemented various strategies for supporting students in this manner.
Analyses of high school course-taking indicate that the "educational productivity" in high schools has increased dramatically, partly as a result of administrative initiatives to accelerate ninth grade algebra enrollments, to require four years of math for graduation, and to require completion of geometry for the high school diploma. The SES Outcomes Report for 1996 showed that the overall completion rate for ninth grade algebra climbed from 60 percent to 72 percent between 1991 and 1996. That increase in educational production for African American ninth graders increased from 37 percent to 51 percent over the same period.
More recent analyses show that the percentage of tenth graders enrolling in geometry or higher-level math has expanded over the past six years. This form of educational productivity most likely derives from the expanded ninth grade algebra enrollments. Geometry or higher-level math in tenth grade is an important stepping stone toward college readiness in the senior year. For example, the percentage of all tenth graders enrolled in geometry or higher-level math increased from 58 percent to 75 percent between 1991 and 1997. Among African American tenth graders the percentage enrolling in geometry or higher-level math rose from 32 percent in 1991 to 57 percent in 1997. For Hispanic tenth graders that percentage nearly doubled over the same time period from 27 percent to 50 percent.
In 1997 the percentage of tenth graders in geometry or higher-level math exceeded the figure found among eleventh graders (73 percent) in 1991. This pattern was also found in comparing the tenth grade African American students in 1997 (57 percent) to the eleventh grade African American students of 1991 (51 percent.) In other words, the college preparatory "math productivity" of high schools moved ahead about one full year between 1991 and 1997.
Several short-term strategies may be useful to enhance SAT performance. First, plan for students to take at least three SAT's during high school, because analyses of SAT scores in MCPS show that students improve with practice. (Practice effects tend to accumulate for up to three tests but diminish thereafter.) Since tests taken through the fall of senior year will be useful for college admissions, plan to spread the three tests over the junior and senior years. About 80 percent of the students taking the SAT also take the PSAT; therefore, the PSAT could constitute one of the three tests. Thus, a typical test profile would be: PSAT or SAT in semester 5; SAT in semester 6; and SAT in semester 7.
Second, among the students in semester 5 of high school, recruit those taking Algebra 2 or higher level math to participate in the PSAT or SAT. The SAT Math subtest contains subject matter no higher than geometry. Thus, those who have completed geometry by tenth grade should be encouraged to take their college preparation seriously by signing up for the College Board tests during the first semester of eleventh grade. Recent analyses show that about 21 percent of Algebra 2 students had not taken the College Board tests by eleventh grade. Among the first-semester eleventh graders taking Algebra 2, the percentages of students who had not yet taken a College Board test were 29 percent for African American students and 16 percent for white students. Teachers and counselors should make sure that these capable students are involved with College Board testing. Collaborating with parents in this process is essential.
Third, prior to the testing session, SAT coaching courses, or books or, computer programs may prove useful to familiarize students with the tests and procedures. Research summaries suggest that the most typical estimate for such short-term "coaching effects" is about 10 points on the SAT. The greatest benefit of such coaching most likely accrues to the first or second test, after which students are already familiar with testing procedures.
This combination of monitoring, encouraging and facilitating students will ensure that the academically prepared students are well-practiced and engaged in the SAT, and can thus contribute their best performance by their senior year. Other students should be encouraged to practice the SAT and participate by their senior year after they have completed geometry course work. The six high school intervention teams have reported several short-term strategies consistent with the approaches discussed above.
This systemic approach to college readiness augments the high school based activities of the implementation teams, and explicitly encompasses all levels of the school system. Elementary schools, middle schools and high schools in each cluster are co-equal partners in cultivating academic preparation, SAT scores and college readiness. Staff must encourage and collaborate with parents, monitor the students stages of college readiness over the years, and help students to formulate their own best and most realistic plans for higher education and life-long learning.
JCL:MH:lrw
| Asian American | African American | Hispanic | White | ||
| A. | n = | 3,296 | 2,583 | 919 | 15,923 |
| B. | Sample Mean | 1054.3 | 815.1 | 890.4 | 1018.3 |
| C. | Constant | 934.5 | 901.2 | 923.6 | 955.4 |
| D. | CAT8 | .51 | .53 | .53 | .50 |
| E. | HiMath | .16 | .20 | .18 | .22 |
| F. | GPA | .17 | .10 | .15 | .11 |
| G. | Honors | .16 | .15 | .14 | .15 |
| R2 = | .79 | .76 | .79 | .78 | |
The standardized regression coefficients in rows D through G indicate how many standard deviation units of change in SAT scores are produced by a one- standard deviation unit change in the high school measure. These coefficients can be compared in size to each other, and they can be added together. For example, among white students the combined effect of the high school curriculum measures (.22 + .11 + .15) is about the same size as the effect of pre-high school academic preparation (.50). The "Constant" in row C indicates the estimated SAT score for a typical high school senior who has studied math as high as trigonometry, has earned a 3.0 grade-point average, and accumulated 5 honors credits. Note that the estimated SAT scores for such students are much more similar across racial groups than are the actual averages in row B. This is due to the fact that racial groups differ in eighth grade preparation levels and in high school course-taking.
Figure 1 shows the regression slopes relating SAT scores of seniors to their academic scores as eighth graders for Asian, African American, Hispanic and white groups. The slopes are not specifically labeled by racial group because the results are so similar.
Complete Report: 1 - 2 - 3 - 4 - 5 - 6 - 7
2000 SAT Report: HOME
![[Navigation Buttons]](gr/smallbanner.gif)
![[MCPS Web Home]](gr/MCPSweb.gif)